|
|
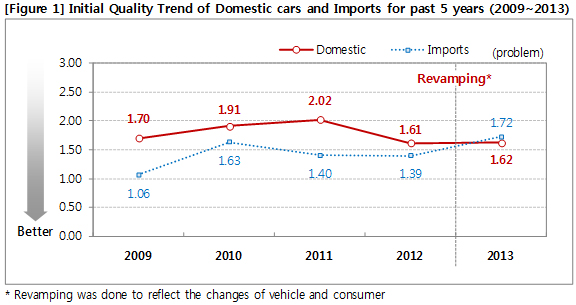
Domestic cars had less number of problems than Imports in Initial Quality for the first time. Especially, this
year’s result was shocking when considering that the Domestic top makers had had more number of
problems than Imports average for past 5 years (since 2008). The real problem here is not because of
Domestic cars getting better or Imports getting worse. But that’s because of the change in measuring method
which can reflect the changes happened to vehicle and consumers. By brand, BMW took the top among
Domestic and Imports altogether, while Hyundai took the 1st place for 2 years in a row among Domestic
cars. |
|
|
Initial Quality is calculated from the average problems per vehicle (or average per 100 vehicles, PPH ;
Problems Per Hundred) for the number of experienced quality problems (TGW-i: Things Gone Wrong-initial)
while using 3 months on average from new car purchase. Therefore, the lower the number, the better the
quality. In Initial Quality study conducted by automobile specialized research firm, Marketing Insight
(www.consumerinsight.co.kr), with 4,112 new car purchased consumers within 6 months (purchase after Jan.
2013), Domestic cars with the average 1.62 problems surpassed Imports (1.72 problems) by 0.1 problem
(10PPH) [Figure. 1]. |
|
|
This is definitely a noticeable change when considering that Imports average had been better than Domestic
top for past 5 years with margins of 0.2 problem (20PPH) or over. But that change happened not because of
actual quality improvement of Domestic cars but because of revamping of some measurement items reflected
from this year’s study. The revamping reflected various changes from the evolution of automobile and the
changes in consumers’ behavior and expectations. Also it enhanced design problem (Design Failure) in
consideration of the recent trend that emphasizes use convenience (User Interface) rather than trouble or
defect (Note 1). |
|
 |
|
|
(Note 1) This study was conducted with the revamped items in 13 areas, 177 items and 544 problem area
and situation (L&O; Location and Occasion) after going through past 2 years’ Bridge Study. Especially,
problems on design that can cause inconvenience in use (Design Failure) were handled in detail. |
|
 |
|
|
In this year’s first study after revamping, Imports displayed the worst number of problems since the 1st study
in 2002 with 1.72 problems, while Domestic cars recorded the similar score at 1.62 problems with the last
year’s best score (1.61 problems). As the result, Domestic cars made an upset in which its average
surpassed Imports average for the first time. |
|
|
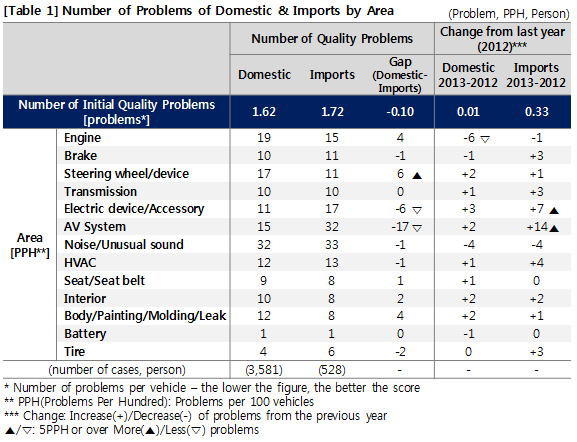
The poor performance of Imports was caused by over the double problems in ‘AV System’ area with 32PPH
than Domestic cars at 15PPH [Table 1]. On top of that, the large gap of 6PPH in the number of problems for
‘Electric device/Accessory’ area also worked. These changes were caused not because Imports’ quality
had worsened essentially but because it exposed many problems in use convenience, which was
enhanced through revamping. |
|
|
In comparison of last year’s result with this year’s result in 13 areas, Domestic had only one area with 5PPH
or over change, while Imports had increased problems in ‘AV System’ area by 14PPH and ‘Electric device/
Accessory’ area by 7PPH. Those are almost double the number from last year. Most of the increased
problems were verified to originate from the added items during the revamping process and the most critical
reason was Navigation. |
|
 |
|
|
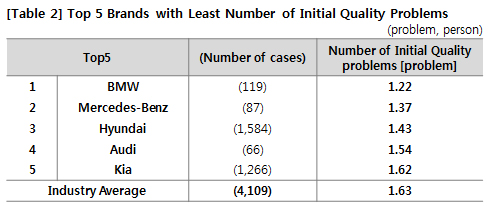
In the comparison by brand, BMW took the 1st place with 1.22 problems, followed by Mercedes-Benz (1.37
problems), Hyundai (1.43 problems), Audi (1.54 problems) and Kia (1.62 problems) with over the Industry
Average (1.63 problems) scores [Table 2]. In the quality problem aspect in the past, the strong players were
Japanese brands such as Lexus, Honda and Toyota. But with the emerging of quality problems from
massive recall crisis in 2009-2010 and the tsunami in 2011, consumers seem to have grown doubts and
shrunken trust. Certainly, consumers trust on Japanese cars is not same as before. |
|
 |
|
|
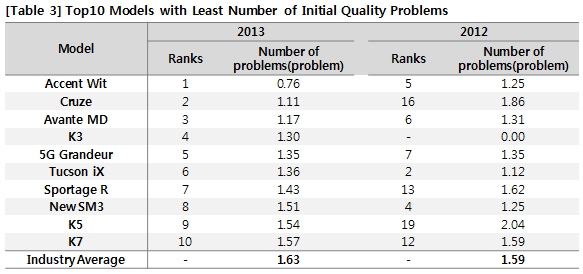
In Top 10 Domestic models with the least number of Initial Quality problems among over 60 cases models,
Accent Wit (0.76 problems) took the 1st place as the only model with less than 1.0 problem, followed by
Cruze (1.11 problems), Avante MD (1.17 problems) and K3 (1.30 problems) [Table 3]. By maker, in the
number of models within Top 10, Hyundai and Kia had the most with 4 models each, while GM Korea’s
Cruze and Renault Samsung’s New SM3 took the remaining seats. |
|
|
The models with excellent improvement from the previous year among Top 10 include Cruze (16th -> 2nd),
K5 (19th -> 9th) and Sportage (13th -> 7th). The reason why Avante MD, which has leaking problem, took
the high ranking can be found in that the survey targets were purchasers (purchasers during Jan. and Jun.
2013) before the leaking problem became an issue (End of Aug.) and the fieldwork was done in July before
the issue making. And the problem seemed to be hard to find during ordinary check-up because it happens
in engine room rather than riding area. |
|
 |
|
|
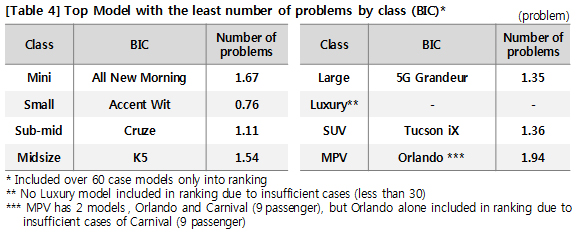
In the models with the least number of Initial Quality problems by class, [Table 4], All New Morning (1.67
problems) in Mini, Accent Wit (0.76 problem) in Small, Cruze (1.11 problems) in Sub-mid, K5 (1.54 problems)
in Midsize, 5G Grandeur (1.35 problems) in Large and Tucson iX (1.36 problems) in SUV took the 1st places
in their class. |
|
 |
|
|
The number of Initial Quality problems is the most importantly considered quality index by automakers. That’s
because poor Initial Quality affects negatively on everything such as Satisfaction for product quality, sales
service and customer service. There was a ground shaking change in this year for Domestic cars
surpassing Imports for the first time, but the reason was on the revamping of questionnaire into the direction
that emphasized electric devices and use convenience, which resulted disadvantage to Imports. But no
matter where the reason lies, Imports are definitely inferior in ‘AV System’ and ‘Electric device/Accessory’
areas. That’s not because of inferiority in technology but because of inconvenience experienced by
consumers. Especially, Navigation problem is the urgent task that Imports should overcome. |
|
Actually, Initial Quality of Korean vehicles has almost not been improved. Typical feature of that is getting worse with many new model releases and recovering with gradual improvement over the time. It barely maintained the score from the previous year because of almost no new Domestic model during past 2 years. For upcoming 2 or 3 years, each maker plans to release new models competitively. Unless there are improvements in pre-release quality management of new model, which had been always problematic ( Quality of Domestic Models cannot catch up Imports with status quo), there is a possibility of reappearance of shameful result, in which Domestic top doesn’t even reach Imports average. |
|
|
|
|
|
|
|
|
|
|
|
|
|
|
|
|
Marketing Insight Inc. has conducted ‘Automobile Quality and Customer Satisfaction Study’ in every July since 2001 with 100k consumers. The study results had been announced at the end of Sep. every year and published as ‘ White Paper on Korean Automobile Quality’, which includes 5 years trend analysis, in Nov. Also the results are utilized by domestic major automakers, auto-importers and automotive-related enterprises. |
|
Media release contents and ‘ White Paper on Korean Automobile Quality’ contents are listed on ‘AutoInsight’ ( www.autoinsight.co.kr), which is ‘Korean online automobile consumer reports’ developed by Marketing Insight Inc., and ‘ Auto Column’ of Daum Automobile section. Especially, ‘AutoInsight’ provides ‘One Page Report’ feature than can compare consumers’ product quality and service evaluations by model. |
|
|
|
|
|
|
|
|
|
|
|
|
|
|
[Research design & outline] |
|
|
|
|
|
|
|
|
|
• Research type: Syndicated study |
|
|
|
|
• Population: Nationwide Automobile user with e-mail account |
|
|
|
|
• Survey period: July 2013 |
|
|
|
|
• Data collection method: Online e-mail survey |
|
|
|
|
• Sample size: Total 101,701 respondents |
|
|
|
|
|
|
|
|
|
|
|
| |
| |
|
The results of this report were excerpted and summarized from the results of ‘Automobile Quality
and Customer Satisfaction Study’ conducted by Marketing Insight Inc. in every July since 2001.
All the rights for study contents, result and analysis deemed to Marketing Insight Inc. and cannot
be used for commercial purpose without prior written permission. More detailed information for
the study can be found at www.autoinsight.co.kr |
| |
|
|
|
|
|
|
|
|
|
|
Copyright ⓒ Marketing Insight. All rights reserved. Cannot be used for commercial purpose. | |
|
|
|
|
|
|
|
|
|
|
|
| |
|
|
|
| |
| |