|
After making a breakthrough of 1% Sales M/S in 2002, Imports has rapidly grown every year with the exception of 2010, which had been stagnant in the global financial crisis. In this year, it passed through 14% M/S and is expecting record-breaking Sales volume of around 200,000 cars. Everyone agrees that sprinting like this continues for a while, but no one can answer how far it will reach. The analysis on purchase behavior of automobile consumers estimated that the rising trend of Imports M/S, according to the current trend, will continue smoothly to at least 27%. |
|
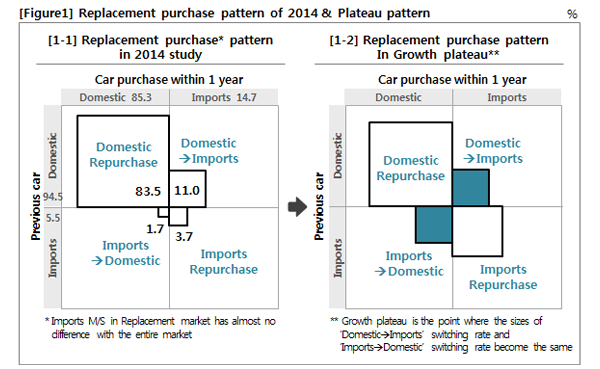
Marketing Insight, an automobile specialist research firm (CEO: Jin-Kook Kim), has conducted large-scale Automobile Syndicated Studies in every July, in which consumers were asked about what car was bought new and what was owned previously (Imports or Domestic). The switching pattern of new car purchased consumers within a year (5,582 people) in this year's survey is as [Figure 1-1]. |
|
 |
|
When looking at the switching pattern in automobile purchase of the past 1 year [Figure 1-1], "Domestic repurchase" that repurchased Domestic car again was the highest at 83.5% among the entire consumers. Following were ‘Domestic→Imports’ switching at 11.0%, "Imports repurchase" that changed to Imports again from Imports at 3.7%, and the cases of switching from Imports to Domestic was only 1.7%. In current switching pattern, ‘Domestic repurchase’ is overwhelmingly high, followed by ‘Domestic→Imports’ switching, ‘Imports repurchase’ and ‘Imports→Domestic’ switching.
When the growth of Imports reaches stagnation, it means that the sizes of the ‘Domestic→Imports’ switching and ‘Imports→Domestic’ switching become the same. To make this possible, the size of ‘Imports repurchase’ should be larger relatively [Figure 1-2]. At this point, the replacement pattern of the four types is to form a balance, while the switching is in a state of being temporarily stagnated. What a lot of people are wondering are when the growth begins to stagnate, and what Imports M/S would be at that point.
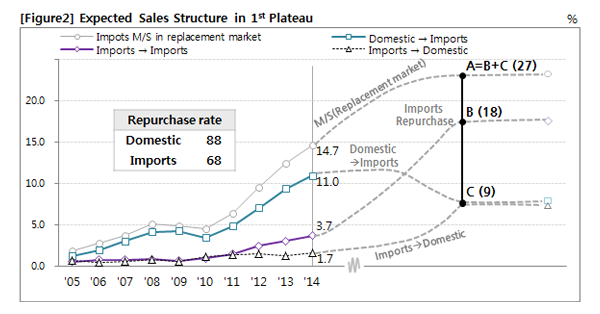
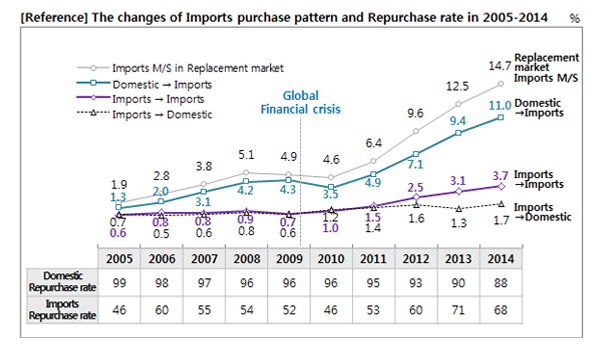
The factors that determine the switching rate in this form in the long term is the Repurchase rates of Imports and Domestic cars. The recent Repurchase rate of Domestic car, which has been declined over the past 10 years, is 88%, while the Repurchase rate of Imports, which is showing a surge recently, is 68% (Attachment: refer to ‘The changes of Imports purchase pattern and Repurchase rate in 2005-2014). In recent years, the gap between these two is shrinking rapidly, but when it will stabilize is unknown. Market deployment scenarios when assuming the current Repurchase rate will not change is as [Figure 2].
|
|
 |
|
If the Repurchase rates of Imports and Domestic cars won’t change, ‘Domestic→Imports’ switching (11.0%) will have no change for the time being and will be gradually decreased. On the contrary, ‘Imports repurchase’ (3.7%) will increase more rapidly, along with Imports M/S that combined both also in rising. After a certain period of time, ‘Domestic→Imports’ switching will decrease to the point where it will be surpassed by ‘Imports repurchase’ and will be as the same as ‘Imports→Domestic’ switching that would begin to increase lately. That point would be the starting point of stagnation period.
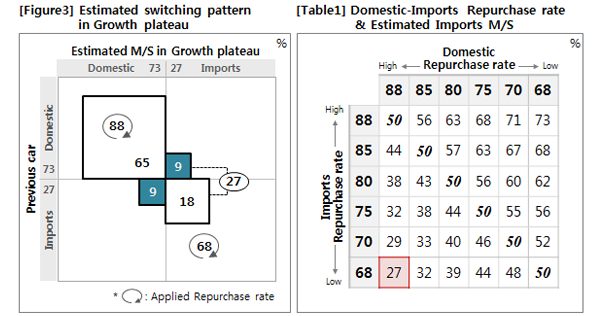
When assuming that there is no change in current Domestic and Imports Repurchase rates, M/S of Imports and Domestic are estimated to converge at 73% and 27%, respectively, and the switching pattern at this time is presented in [Figure 3].
This figure shows that of the plateau will start when ‘Domestic→Imports’ switching and ‘Imports→Domestic’ switching have a ratio of 9%, at which ‘Imports repurchase’ rate will reach 18% at this time, making Imports M/S at 27%.
|
|
 |
|
M/S of durable consumer goods that are used for a long period of time such as automobile does not change drastically. It is possible to say that there is no sudden change because automobile has many variables linked together such as research and development, production, Sales, post-sales management, A/S and resale, unlike low-involvement low-priced products. However, reversal and selection in long-term period is happening continuously in many parts of the world.
Many people have wondered about at what percentage Imports would start to take a breather but no one has answered openly. This analysis result, which is based on the current Repurchase rates of Imports and Domestic, presents that Sales M/S of Imports will cruise at least to 27% as long as there is no special change, and the decisive factor is the Repurchase rate.
The point that should not be forgotten is that this prediction is based on the assumption, which is unrealistically optimistic and hopeful. Aggression of Imports will be more intense, while the defense of Domestic car would be much more difficult than this.
|
|
 |
|
================================== |
|
|
|
|
|
|
|
|
|
|
|
|
|
|
|
|
Marketing Insight Inc. has conducted ‘Automobile Quality and Customer Satisfaction Study’ in every July from 2002 to 2014 with 100k consumers. The study results had been announced as press releases from the end of Sep. every year. Also the results are utilized by domestic major automakers, auto-importers and automotive-related enterprises.
|
|
Media release contents and ‘ Korean Automobile Quality Report’ contents are listed on
‘AutoInsight’ ( www.autoinsight.co.kr), which is ‘Korean online automobile consumer reports’
developed by Marketing Insight Inc., and ‘ Auto Column’ of Daum Automobile section. Especially,
‘AutoInsight’ provides ‘One Page Report’ feature than can compare consumers’ product quality
and service evaluations by model. |
|
|
|
|
|
|
|
|
|
|
|
|
|
|
[Research design & outline] |
|
|
|
|
|
|
|
|
|
• Research type : Syndicated study |
|
|
|
|
• Population : Nationwide Automobile user with e-mail account |
|
|
|
|
• Survey period : July 2014 |
|
|
|
|
• Data collection method : Online e-mail survey |
|
|
|
|
• Sample size : Total 101,821 respondents |
|
|
|
|
|
|
|
|
|
|
|
|
|
|
|
|
The results of this report were excerpted and summarized from the results of ‘Automobile Quality
and Customer Satisfaction Study’ conducted by Marketing Insight Inc. in every July since 2002.
All the rights for study contents, result and analysis deemed to Marketing Insight Inc. and cannot
be used for commercial purpose without prior written permission. More detailed information for
the study can be found at www.autoinsight.co.kr |
|
|
|
|
|
|
|
|
|
|
|
| |
Copyright ⓒ Marketing Insight. All rights reserved. Cannot be used for commercial purpose. |
|
|
|
|
|
|
|
|
|
|
|
|
|
|
|
|
|
|
|
|
|