|
Following the prediction that the market share of imported cars can go up to 20% by 2016, there came out the prospect that it would go well up to at least 27% by 2020. The predicted value based on the vehicle replacement cycle and the repurchase rate of domestic & imported cars is the result from conservative assumption on several conditions. In fact, it is expected to be possible reaching 27% before that time. |
|
Marketing Insight (President: Jin-Kook Kim), an automobile specialist research firm, has been conducting a large-scale Automobile Syndicated Study with around 100,000 samples every year in July. In the last year, it forecasted that the market share of imported cars can rise up to 20% by 2016 by taking sales performance and consumer's purchase intention into account (Refer to: Imports, going for 20% by 2016). |
|
In this year's survey, the switching pattern of new replacement car purchased consumers (5,582 persons) during past 1 year was analyzed to forecast that the market share of imported cars in the future would steadily rise up to minimum 27% (Refer to: M/S of Imported car, will be cruising at least to 27%). However, this prediction did not specified the arrival time to 27%, and had a limitation of unrealistic assumption base, in which the repurchase rates of domestic cars and imported cars won’t change that had been rapidly changing. In the results of setting replacement cycle of consumers to 5 years(61.4 months) and applying the repurchase rates in three scenarios, reaching 27% will happen at latest by 2020. |
|
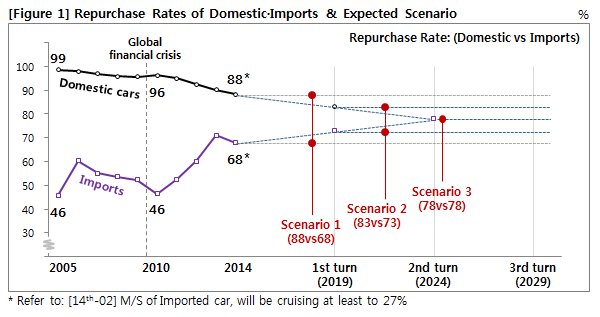
In the forecast process, the repurchase rates of domestic cars and imported cars during the period from 2005 to 2014 were mapped first [Figure 1]. Since 2010, the repurchase rate of domestic cars had been reduced by 2%p yearly rate on average from 96% to 88%, while that of imported cars had increased by 5.5%p yearly rate on average from 46% to 68%. When applying this trend as it is, the gap of repurchase rates between domestic cars and imported cars at current 20%p will be reduced by 7.5%p per year, reversing the position after just three years. While considering that is unrealistic, three scenarios were presented except that. |
|
 |
|
Scenario 1 assumed that the 2014 repurchase rate of imported cars and domestic cars will continue without change. Scenario 2 is the case of domestic and imported cars' repurchase rates getting reduced/increased by 1%p per year for 5 years of new car replacement cycle, and getting fixed at 83% for domestic and 73% for imports from 2019. Scenario 3 is the case of continuing such a change for 10 years of 2 replacement cycles, and getting fixed at 78% of both imports and domestic from 2024. |
|
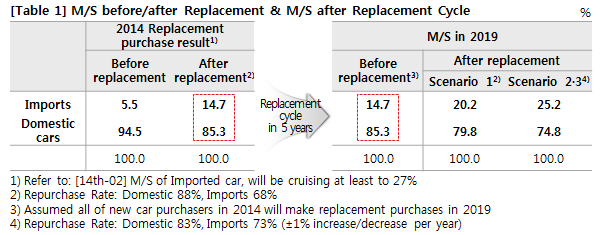
The average replacement cycle is more important factor than repurchase rate in forecasting market share. That's because considering replacement cycle and repurchase rate at the same time enables to predict by time series point. From the research results of Marketing Insight, what kind of influence the average 5-year replacement cycle inflicted to the study result of 2014, and how that has been utilized in forecasting future along with the forecast result are present in the below [Table 1]. |
|
 |
|
When looking into the before and after situation of the 2014 replacement purchasers, which is the analysis subject of this study, imported cars ownership rate before the replacement was only 5.5%, but after replacing according to repurchase rate, the M/S of import car increased by 9.2%p to 14.7%. The right pane displays the result of assumption that all of 2014 replacement purchasers would make replacement purchases after five years in 2019. [Figure 2] is estimated figures of market share, when such a change repeats 3 times of the replacement cycle (15 years). |
|
 |
|
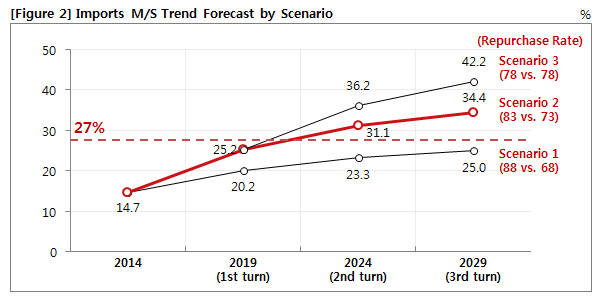
According to each scenario, after the first replacement cycle (2019), M/S of imported cars was predicted as 20.2% in Scenario 1 and 25.2% in Scenario 2 (in this year, Scenario 3 is same). It displays the 5%p gap in market share from ±1%p repurchase rate change per year during the five years. |
|
10 years after in 2024 also, the M/S of Imported cars at the second replacement cycle (2024) would be 23.3% in the case of Scenario 1, 31.1% in the case of Scenario 2 and 36.2% in the case of Scenario 3. M/S of Imported cars at the third replacement cycle (2029) would be 25.0% in the case of Scenario 1, 34.4% in the case of Scenario 2 and 42.2% in the case of Scenario 3. |
|
When looking into specific feature by scenario, Scenario 1, which assumes that the current repurchase rate would remain same, displayed the tendency to converge at 27%, the forecast value of first plateau, gradually for a long period of time (Refer to: M/S of Imported car, will be cruising at least to 27%). Scenario 2 tended to increase to 31.1% by the second replacement cycle in 2024, and to 34.4% in the next turn. In this scenario, reaching 27% is presumed to be 2020, right after the first cycle. In the case of Scenario 3, it appeared to be steadily rising to 36.2% at the second replacement cycle and to 42.2% in the next turn. Reaching 27% is expected to be year 2020 as same as Scenario 2. |
|
Of the above three scenarios, Scenario 1 is impractical with no change in the repurchase rate. Scenario 3 becomes to have same repurchase rate at 78% for domestic and imported after 2024, which predicts 50 to 50 M/S of domestic and imports in long-term, making it unrealistic also. There must be the consumers unable to switch, due to economic reasons, social attitudes and atmosphere. However, even in this case, there is no difference with Scenarios 2 in the arrival time to 27%. |
|
At present, it is estimated that Scenario 2 is the most reasonable. In this case, 27% M/S of imported cars will arrive in 2020. This is a prediction for the future in next six years, which means that imported cars will increase by 2%p per year from this year, when the market share passed over 14% mark. However, in terms of setting the change of repurchase rate at a very conservative level, it also can be said ‘by 2020 at latest’.
The biggest current in the present market is migrating to imported cars from domestic cars. Enhancing the existing customers’ satisfaction and loyalty along with presenting attractive products for lead to repurchase will be able to alleviate the current rapid leaning phenomenon. But that is never easy job. (Refer to: Greatly satisfied is the consumers who switched to Imported car from domestic!).
|
|
================================== |
|
|
|
|
|
|
|
|
|
|
|
|
|
|
|
|
Marketing Insight Inc. has conducted ‘Automobile Quality and Customer Satisfaction Study’ in every July from 2002 to 2014 with 100k consumers. The study results had been announced as press releases from the end of Sep. every year. Also the results are utilized by domestic major automakers, auto-importers and automotive-related enterprises.
|
|
Media release contents and ‘ Korean Automobile Quality Report’ contents are listed on
‘AutoInsight’ ( www.autoinsight.co.kr), which is ‘Korean online automobile consumer reports’
developed by Marketing Insight Inc., and ‘ Auto Column’ of Daum Automobile section. Especially,
‘AutoInsight’ provides ‘One Page Report’ feature than can compare consumers’ product quality
and service evaluations by model. |
|
|
|
|
|
|
|
|
|
|
|
|
|
|
[Research design & outline] |
|
|
|
|
|
|
|
|
|
• Research type : Syndicated study |
|
|
|
|
• Population : Nationwide Automobile user with e-mail account |
|
|
|
|
• Survey period : July 2014 |
|
|
|
|
• Data collection method : Online e-mail survey |
|
|
|
|
• Sample size : Total 101,821 respondents |
|
|
|
|
|
|
|
|
|
|
|
|
|
|
|
|
The results of this report were excerpted and summarized from the results of ‘Automobile Quality
and Customer Satisfaction Study’ conducted by Marketing Insight Inc. in every July since 2002.
All the rights for study contents, result and analysis deemed to Marketing Insight Inc. and cannot
be used for commercial purpose without prior written permission. More detailed information for
the study can be found at www.autoinsight.co.kr |
|
|
|
|
|
|
|
|
|
|
|
| |
Copyright ⓒ Marketing Insight. All rights reserved. Cannot be used for commercial purpose. |
|
|
|
|
|
|
|
|
|
|
|
|
|
|
|
|
|
|
|
|
|