|
The biggest problem of imported cars’ A/S is a time and cost. Imported car owners are not comfortable with meaningless waiting time as much as excessive spending on cost. And yet, A/S satisfaction of Japanese car owners overwhelms other automakers. The things that European cars should learn from Japanese cars can be summarized as ·shortening time from arrival to service start, ·opening maintenance process, ·reduction of recurring problem rate. |
|
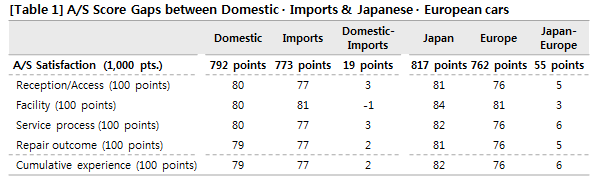
A/S satisfaction in the mega-scale syndicated study on ‘Customer Satisfaction and Experienced Quality of motor vehicle’ conducted every year by Marketing Insight, an automobile specialty research firm, comprises of ‘Reception/Access’, ‘Facility’, ‘Service process’ and ‘Repair outcome’ of recently received A/S service (21 items in 4 Divisions), and cumulative evaluation on A/S of automaker (6 items in 1 Division) experienced during the past one year. [Table 1] presents the results of comparison between domestic and imported cars, and between Japanese cars and European cars among imports. |
|
 |
|
A/S satisfaction of domestic cars was 792 points (1000-point scale) on average, while imported cars scored 773 points, making domestic cars 19 points higher than imported cars. Among imported cars, Japanese cars were whopping 55 points higher at 817 points than European cars at 762 points. Europe cars are rampant by taking 80% of current imported car market but are seriously inferior in A/S area (Refer to: Imported Car A/S Satisfaction Analysis (1) - Outstanding Japanese Cars but Serious European Cars). |
|
When looking into the divisions that make up A/S satisfaction, imported cars surpassed domestic cars (80 points) by just 1 point in ‘Facility’ division only with 81 points (100-point scale), but lagging behind in all other divisions. It lagged behind by 3 points in ‘Reception/Access’ and ‘Service process’ divisions, and by 2 points in ‘Repair outcome’ and ‘Cumulative experience’ divisions. In comparison between Japanese car and European cars, there were 3-6 points gaps by division, the largest gap by 6 points in ‘Service process’ and ‘Cumulative experience’ divisions, 5 points gap in ‘Reception/Access’ and ‘Repair outcome’ divisions, and 3 points gap in ‘Facility’ division. Japanese car displayed firm superiority in A/S service against domestic cars also with 1-4 points higher scores. |
|
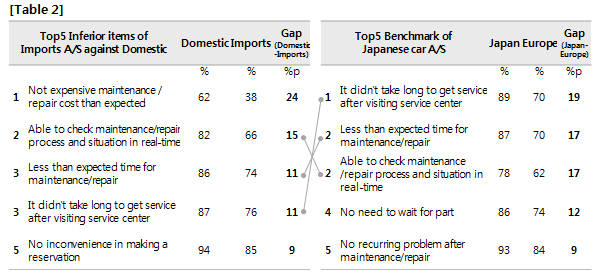
Top 5 items with the largest gap in positive response rate between imported cars and domestic cars in the evaluation on recently received A/S are presented in [Table 2]. The largest gap between 2 groups was ‘1. Not expensive maintenance/repair cost than expected’, in which domestic cars had positive response rate at 62% but only 38% of imported car owners agreed, being 24%p lower than domestic cars. This question had the lowest positive response rate among both of the domestic car and imported car owners, but imported cars had the worst rating at over 20%p lower than any other question. All of imported car owners have been prepared in anticipation for high A/S cost. It reflects that 3 out of 5 people felt higher than expected cost even with the anticipation. This challenge requires urgent improvement. |
|
 |
|
The following largest gaps were ‘2. Able to check maintenance/repair process and situation in real-time’ (15% p), ‘3. Less than expected time for maintenance/repair’ (11% p) and ‘5. No inconvenience in making a reservation’ (9% p), in order. 4 out of Top 5 question items with significantly lower satisfaction rate of imported cars than domestic cars were related to the procedures and time. |
|
Not all of imported car A/S have problems. Japanese cars are flying a way over domestic cars, and European cars do not reach the lowest of domestic cars. European cars need to benchmark Japanese cars for how they satisfy customers. Among Top 5 question items with the largest gaps between Japanese cars and European cars, Top 4 items are related to time, while Top 3 are also pointed out in the largest gaps with domestic cars. |
|
Top 3 items with the largest gaps were ‘1. Long waiting time after arriving at the service center’, ‘2. Longer overall time than expected’ and ‘3. Blocked from viewing maintenance/repair process’, all of which had over 17%p gaps. The reason for this phenomenon appearing cannot be identified whether because of infrastructure deficiencies for providing basic A/S, or not efficiently designed procedure. But it is clear that it became the great inconvenient for consumers. In addition to this, the critical threat factor to A/S satisfaction, ‘Recurrence rate of the same problem’, was 16% for European cars, which was more than twice of Japanese cars at 7%. |
|
European cars take the most of imported cars, as well the most of luxury cars. They are people who want to ensure time even with spending more money rather than saving cost by using time. Making them uncomfortable at the first stage of service is not advisable in any case. Making them spend time without doing anything after arriving at the service center to receive A/S is the start of lousy service. In addition to that, making it difficult to know the progress, charging more expense than expected, and re-repair with the same problem will be the worst finish. European cars are necessary to actively benchmark the service of Japanese cars. |
|
================================== |
|
|
|
|
|
|
|
|
|
|
|
|
|
|
|
|
Marketing Insight Inc. has conducted ‘Automobile Quality and Customer Satisfaction Study’ in every July from 2002 to 2014 with 100k consumers. The study results had been announced as press releases from the end of Sep. every year. Also the results are utilized by domestic major automakers, auto-importers and automotive-related enterprises.
|
|
Media release contents and ‘ Korean Automobile Quality Report’ contents are listed on
‘AutoInsight’ ( www.autoinsight.co.kr), which is ‘Korean online automobile consumer reports’
developed by Marketing Insight Inc., and ‘ Auto Column’ of Daum Automobile section. Especially,
‘AutoInsight’ provides ‘One Page Report’ feature than can compare consumers’ product quality
and service evaluations by model. |
|
|
|
|
|
|
|
|
|
|
|
|
|
|
[Research design & outline] |
|
|
|
|
|
|
|
|
|
• Research type : Syndicated study |
|
|
|
|
• Population : Nationwide Automobile user with e-mail account |
|
|
|
|
• Survey period : July 2014 |
|
|
|
|
• Data collection method : Online e-mail survey |
|
|
|
|
• Sample size : Total 101,821 respondents |
|
|
|
|
|
|
|
|
|
|
|
|
|
|
|
|
The results of this report were excerpted and summarized from the results of ‘Automobile Quality
and Customer Satisfaction Study’ conducted by Marketing Insight Inc. in every July since 2002.
All the rights for study contents, result and analysis deemed to Marketing Insight Inc. and cannot
be used for commercial purpose without prior written permission. More detailed information for
the study can be found at www.autoinsight.co.kr |
|
|
|
|
|
|
|
|
|
|
|
| |
Copyright ⓒ Marketing Insight. All rights reserved. Cannot be used for commercial purpose. |
|
|
|
|
|
|
|
|
|
|
|
|
|
|
|
|
|
|
|
|
|