|
Consumer satisfaction for automakers had declined in every year, while dissatisfaction had increased. There is even a possibility of higher dissatisfaction rate than satisfaction rate within next few years. For the past decade, the satisfaction rate of the domestic cars has been lower than imported cars, and the gap has become larger and larger. The rapid increase of imported car sales seems to be related to this also. The key consumer dissatisfaction against domestic automakers is in labor-management relations. The negative perception of consumers for labor relations is at the bottom level that can no longer fall, which also take down the evaluations of other aspects. On the flipside of the endless falling image of domestic automakers, there is a disappointment on the labor relationship. |
|
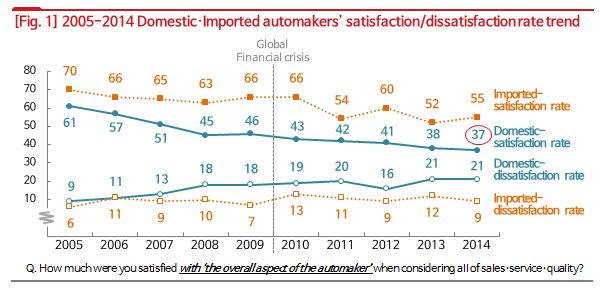
Marketing Insight, an automobile specialized research firm, asked the consumers who purchased new car within one year (7,443 people in the case of 2014) in the annual Automobile Syndicated Study that has been carried out for past 10 years from 2005 to evaluate ‘How much were you satisfied with overall aspect of the automaker’ when considering the sales, service & quality of the automaker comprehensively in the 10-point scale. 8 points or higher evaluation in this question was classified as ‘Satisfied’, while the evaluation with 5 points or lower was classified as ‘Dissatisfied’. And the summary of the trend in the overall satisfaction rate for the past 10 years on domestic & imported car manufacturers is shown in [Fig. 1]. |
|
 |
|
There are some specific phenomenon in the Overall Satisfaction rate (percentage of 8 points or over on 10 points scale) for the overall sales·service·quality of the automaker that was evaluated by the consumers who purchased the car within a year. •In 2014 study, only 37% of new domestic car purchased consumers were satisfied with the automaker. That was too low when compared with foreign countries. •The satisfaction rate of domestic automaker had declined consistently in every year with an exception in 2010, when there was the global financial crisis. There seems to be a systematic factor that had taken down the satisfaction rate continuously. There is a large gap in satisfaction rate between domestic automakers and imported automakers. Ten years ago, the gap did not reach the 10%p (9%p) but it became larger and larger to 18%p. •In contrast, the satisfaction rate of imported cars had been relatively stable. It has had ups and downs with small margins in the mid-60% range during 2010 or earlier and in the mid-50% range since 2011. In other words, although imported cars had declined too, the declining margin of domestics had been much larger. |
|
In contrast with the satisfaction rate, the dissatisfaction rate for domestic cars has been in rising trend. •Dissatisfaction rate for imported automakers has been stable at around 10% without significant changes over the past decade. •On the other hand, the domestic automakers started with 9% in 2005 but it went up by more than double to 21% in 2014. Excluding the exceptional declining in 2012, it is possible to know that the dissatisfaction rate had steadily increased. There must be a consistent systematic cause that lowers satisfaction rate and raises dissatisfaction rate./div> |
|
Declining satisfaction rate and increasing dissatisfaction rate of domestic automakers has rapidly narrowing the gap between those two figures. The 52%p gap in 2005 between 61% satisfaction and 9% dissatisfaction was reduced to below one-thirds level at 16%p in 2014. If this trend continues, there could be a bizarre situation, in which ‘the dissatisfaction rate of new car purchasers within a year’ could be higher than the satisfaction rate in the near future. |
|
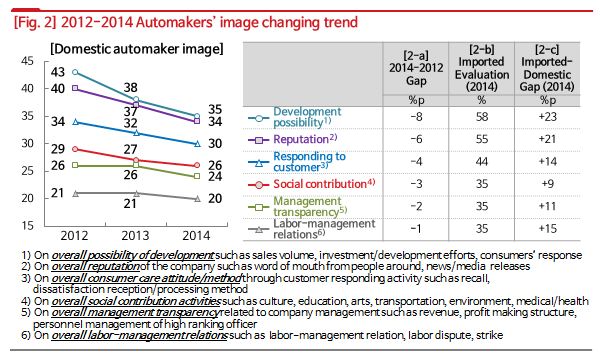
In order to find out which aspect of automaker is related to decrease of satisfaction and increase of dissatisfaction, how much they affirmatively consider 6 aspects such as the development possibility and reputation of automaker was asked in 10-points scale from 2012. By considering 8 points or over as the satisfaction rate, the trend of the past three years is summarized in [Fig. 2]. |
|
 |
|
In the result of 2014 study for domestic automakers, ‘Development potential’ was the highest at 35%, followed by Reputation at 34%, Consumer support attitude/system at 30%, Social contribution activities at 26%, Management transparency at 24% and Labor-management relation at 20%, in order. The lowest in the six aspects was ‘Labor-management relation’, which is not about the relationship with consumers or future prospects but completely about internal issues of company. The second lowest ‘Management transparency’ was also the internal problem of the company, displaying the biggest dissatisfaction of consumers on the management type of the company. |
|
When looking into the size changes of satisfaction rates for the six aspects [2-a] in the last two years, it is possible to know that all have been lowered, among which the ones with higher satisfaction rate became lowered more. While the overall changing trend displayed very consistent tendency, the evaluation tended to have a funnel shape that converges into the lowest one. Labor relations has already sunk to the bottom at 20% range in the consumers’ evaluation without a room to decline which gives the impression to take down the evaluation scores of all other things. |
|
The satisfaction rates by aspect for imported automakers [2-b] are between the highest at 58% (the possibility of development) and the lowest at 35% (3 aspects including labor-management relations). The evaluation on imported automakers displayed the wider gap from 9%p to 23%p higher rates than domestic automakers [2-c]. On the back of the rapidly tilting phenomenon of recent consumers’ selection to imported cars, there is a presumed low evaluation on the domestic automakers by the domestic car buyers. |
|
Current consumers’ view to the current domestic automakers is chilling. The fact that the only 37% of the vehicle purchased consumers within a year are satisfied with the company is a serious matter (US ACSI & British NCSI data display the satisfaction rate at 80% or over). The satisfaction rate of domestic cars had steadily decreased over the past decade, and the gap with the imported cars had also become larger and larger. The survey result of significantly higher satisfaction rate of consumers who switched from domestic cars to imported cars ( Refer to: Greatly satisfied is the consumers who switched from Domestic to Imported car!) can be a warning message from the consumers to domestic automakers. |
|
This gap leads imported cars to unstoppable sprint. It is expected to reach 20% by 2016 or there is a forecast for reaching 27% by 2020 ( Refer to: Imported car will take 27% by 2020 at latest). The most definite support for these views is a dissatisfaction and disappointment of recent domestic car buyers against the purchased automaker. At the bottom of the dissatisfaction and disappointment, there is a negative attitude towards labor-management relations of the automaker which takes a role of a black hole that takes down all the evaluations. Unless there is a change in the negative attitude on the labor-management relations that fell to the bottom, the future of domestic automakers should remain unclear. |
|
================================== |
|
|
|
|
|
|
|
|
|
|
|
|
|
|
|
|
Marketing Insight Inc. has conducted ‘Automobile Quality and Customer Satisfaction Study’ in every July from 2002 to 2014 with 100k consumers. The study results had been announced as press releases from the end of Sep. every year. Also the results are utilized by domestic major automakers, auto-importers and automotive-related enterprises. |
|
Media release contents and ‘ Korean Automobile Quality Report’ contents are listed on
‘AutoInsight’ ( www.autoinsight.co.kr), which is ‘Korean online automobile consumer reports’
developed by Marketing Insight Inc., and ‘ Auto Column’ of Daum Automobile section. Especially,
‘AutoInsight’ provides ‘One Page Report’ feature than can compare consumers’ product quality
and service evaluations by model. |
|
|
|
|
|
|
|
|
|
|
|
|
|
|
[Research design & outline] |
|
|
|
|
|
|
|
|
|
• Research type : Syndicated study |
|
|
|
|
• Population : Nationwide Automobile user with e-mail account |
|
|
|
|
• Survey period : July 2014 |
|
|
|
|
• Data collection method : Online e-mail survey |
|
|
|
|
• Sample size : Total 101,821 respondents |
|
|
|
|
|
|
|
|
|
|
|
|
|
|
|
|
The results of this report were excerpted and summarized from the results of ‘Automobile Quality
and Customer Satisfaction Study’ conducted by Marketing Insight Inc. in every July since 2002.
All the rights for study contents, result and analysis deemed to Marketing Insight Inc. and cannot
be used for commercial purpose without prior written permission. More detailed information for
the study can be found at www.autoinsight.co.kr |
|
|
|
|
|
|
|
|
|
|
|
| |
Copyright ⓒ Marketing Insight. All rights reserved. Cannot be used for commercial purpose. |
|
|
|
|
|
|
|
|
|
|
|
|
|
|
|
|
|
|
|
|