|
2016 Automobile Consumer Reports;
Why are people flocking to imported cars? |
|
|
|
1. Up to where can Imported cars reach? (Jan. 07) |
|
2. Why do they consider imported cars? (Jan. 12) |
|
3. Which one should be blamed? Product or Brand?(Jan. 14) |
|
4. Greatly satisfied when switching from domestic to imported cars! What about vice versa? (Jan. 19) |
|
5. Hyundai Motors, a company that does reverse discrimination after growing because of consumers
(Jan. 21) |
|
6. 70% of imported cars ‘will engage airbag upon accident’. How about domestic cars?(Jan. 26) |
|
7. Vehicle corrosion, five times of imported cars (Jan. 28) |
|
| |
|
|
1.Up to where can Imported cars reach? |
|
|
|
– ‘To buy imported car’ can be larger than ‘to buy Hyundai cars’ after three years. |
|
– - By 2016, Benz can be a strong contender for 5th preferred brand above domestic |
|
– Imports purchase surpassed Hyundai in Gangnam, Seocho & Suji |
|
|
The market was partially open to imported car in 1987, but it had passed through the ultra-low growth period and surpassed 1% mark after 15 years in 2002. The rapid growth trend continued thereafter, and had written new record in each year with the exception of 2009 for global financial crisis. Although there was a jumbo size bad news of diesel scandal in this year, it is expected to pass 200,000 sales volume and 16% market share. The forecast on 10% or 15% limit had already become old tales, and 20% is just ahead. As long as there is no big change, the forecast has come out that it would go up to 27% in 2020 based on the replacement purchase market ( Source: Consumer Insight’s Consumer evaluation report [14-08] released on Oct. 28 2014.) |
|
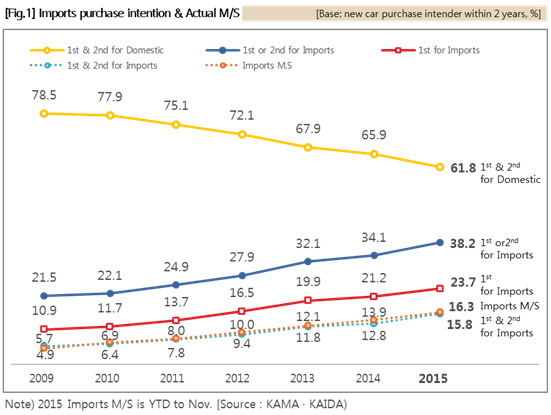
Increased sales of imported cars is because there is a matching demand. Since 2001, the consumers who would buy a new car within next two years were asked about which car they would buy in the annual automobile survey of Consumer Insight that has been done every year. In the result of 2015, 23.7% of the consumers chose imported car as first place in purchase intended vehicle, while 15.5% chose imported car as both first place and second place [Figure 1]. Interesting thing is that the actual market share of Imports has been almost exactly matched with the rate of consumers, who chose imported cars as both first place and second place, for the past few years. |
|
On the other hand, the answers ‘to consider domestic cars only’ had reduced by 16.7%p from 78.5% in 2009 to 61.8% in 2015. This indicates that the response considering imported car (as 1st or 2nd in ranks) has doubled to two people (38.2%) from one person (21.5%) out of five people. In terms of purchase intention rate on graph, sales of imported car is believed to continue the rising trend. There is no clue to be found anywhere that it will turn to declining trend. |
|
 |
|
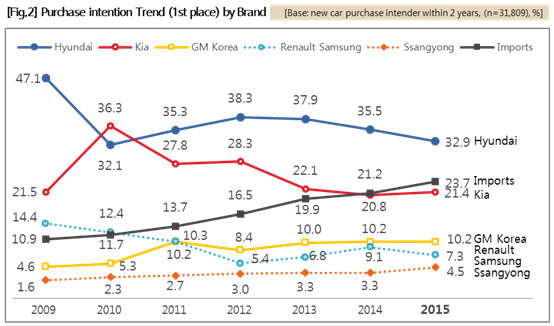
When comparing 1st rank rate for Imports purchase intention with the domestic brands, it is possible to know better how much threat the momentum of imported cars is. In the 1st place of purchase intention only, imported cars is 23.7%, not only higher than the Kia (21.4%) but also higher than GM Korea - Renault Samsung - Ssangyong combined (22.0%) [FIG. 2 ]. The gap with Korean market leader Hyundai (32.9%) is just 9.2%p. For the past three years, the gap in purchase intention rate between Hyundai and imported cars has decreased by 3%p or more every year. In view of this, imported car purchase intention rate can also step up to 1st place after two years in 2018 by surpassing Hyundai while passing the current gap of 9.2%p. |
|
 |
|
In Imports purchase intention by brand, German cars swept the top level including Benz 4.4%, BMW 4.1%, Volkswagen 3.9% and Audi 3.3%. Imports 1st place Benz at 4.4% has a little difference with Ssangyong at 4.5%. This indicates that an imported brand will surpass a domestic brand shortly in purchase intention. |
|
It has been confirmed that the actual sales is closely related to purchase intention of the consumers. 2015 Imports purchase intention rate at 23.7% as 1st place looks like to have a large gap with this year's market share at 16%. However, the 1st place selection rate of just four years ago in 2012 was 16.5%, which has no difference with 2015 market share after three years. When predicting the situation of two years later in 2018, imported car purchase intention rate is likely to be higher than Hyundai car purchase intention rate, as well as a possibility of Imports market share passing beyond 20%. |
|
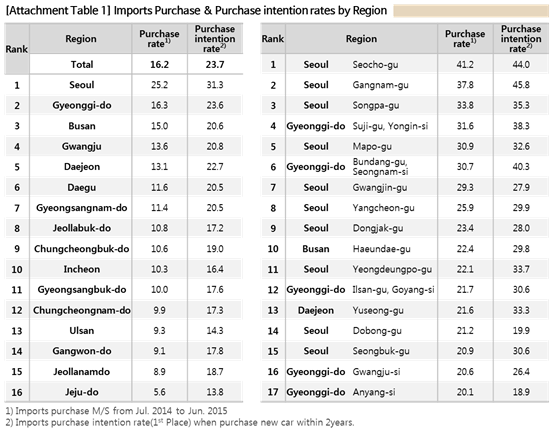
In fact, 2015 imported car’s purchase rate surpassed that of Hyundai in several regions. In Gangnam-gu (38%), Seocho-gu (41%) & Seongdong-gu (42%) of Seoul and Yongin Suji (32%), imported car purchase surpassed Hyundai purchase [Refer to attachment Table 1]. Metropolitan area centered imported car boom is gradually spreading to the large local cities such as Busan, Gwangju, Daejeon & Daegu. After 2-3 years, imported cars will reach over 20% M/S with 300k units, and can also bring up imported car brand that can sell a lot more than domestic brands. |
|
Why are the consumers flocking to imported cars? |
|
 |
|
|
| |
|
|
2. Why do they consider imported cars? |
|
|
|
– When performance-price are the same, no distinction of domestic-imported |
|
– Imported cars’ strength is product, while weakness is cost and service |
|
– In overall, imported has excellent value for the price |
|
|
Rising trend of imported cars is because there are some own strengths. Consumers believe for sure that imported cars have comparative advantages in product aspect. On the other hand, it is vulnerable in terms of cost and service. However in overall aspect, imported cars has surpassed the domestic car in the value for money. The consumers who intend to buy imported cars see a large gap in the value for money. It is natural to see consumer following good performance for price. |
|
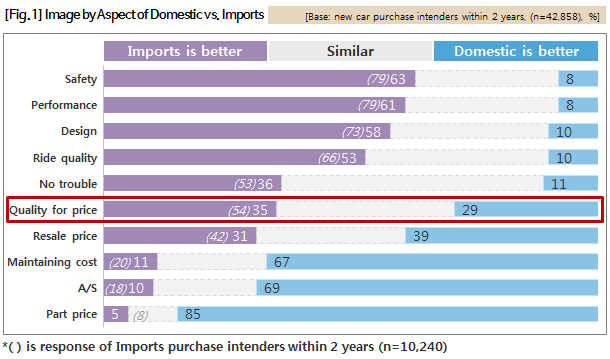
In order to figure out the relative competitive advantage between imported cars and domestic cars from consumers’ viewpoint, 42,858 purchase intenders of new car within two years were asked to choose which side is better in 10 aspects such as product, quality and cost. As a result, domestic cars were evaluated as excellent in cost, while imported cars were evaluated as excellent in products and quality aspects. |
|
Three out of five purchase intenders chose ‘imported car in the better’ product features such as safety, performance and design, while only one in ten chose ‘domestic car as better’ one [Figure 1]. On the other hand, in cost and A/S, most chose domestic cars with the overwhelming dominance. The response to choose ‘imported cars for better’ parts price, A/S and vehicle maintenance costs aspects were only 5%, 10% & 11%, respectively. In other words, the unrivaled superiority was clearly divided into imported cars in product aspect and domestic cars in cost and service. |
|
 |
|
On the whole, almost all the people admit that imported cars cost much money as seen in ‘parts price’. Imports purchase intenders were also not much different from that, but they clearly took a side for Imports in ‘Safety’ and ‘Performance’ (79% each). They considered that Imports have more merits (13%p or over), and tended to evaluate the weakness at somewhat lower level. |
|
In order to compare relative superiority or inferiority between products and cost, people were asked about how was ‘quality for price’ aspect. In the result, more people chose imported cars as better at 35% vs. 29%. This indicates that the relatively larger number of consumers considers the imported car’s superiority in product & quality as larger than the inferiority in cost. Such a decision was even stronger among imported car purchase intenders, favoring imported cars by majority at 54%. They knew about the weaknesses of Imports but also believed that it has more merit that can cover those weaknesses. |
|
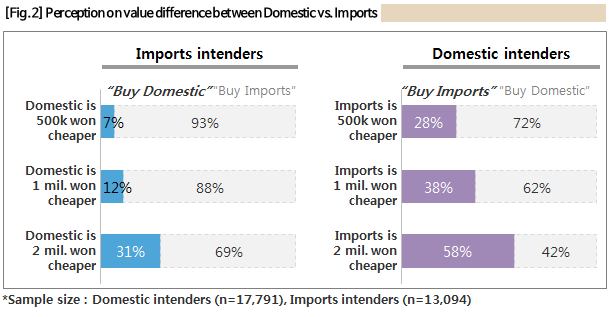
In order to find out the gap in consumer felt value, people were asked about whether to switch the car, when the not-preferred car is 500k won, 1 million won or 2 million won cheaper. Among imported car preferred people, the intention to buy domestic car when the price is 500k won, 1 million won or 2 million won cheaper had increased to 7%, 12% & 31% [Figure 2]. That is, even at 2 million won cheaper price, switching to domestic car was only 3 out of 10 people. |
|
On the other hand, among domestic car preferred people, the intention to buy imported car when it is cheaper had rapidly increased to 28%, 38% & 58%. This indicates that seven out of 10 imported car preferred people consider imported car as having more value at 2 million won or over, while 6/10 of domestic car preferred people consider the gap as 2 million won or less. |
|
 |
|
Imported car has been evaluated as having value for money in spite with cost and A/S related serious weaknesses. And that is believed to attract consumers into the imported car market. If imported cars get a competitive edge in terms of price also, the speeding of Imports will be accelerating even more. In the past, the competition was among 5 domestic brands with 40 to 50 models. But now the market became a battle ground of over 20 brands with hundreds of models. The battle changed from local conflict to all-out war, and there is no weapon that has destructive power as price. |
|
There was a diesel scandal of Volkswagen in September, and there was a forecast that the problem was not a just a matter of Volkswagen but will spread to all imported cars’ problems beyond the entire German cars or diesel-powered vehicles. Volkswagen Group, which experienced a serious slump in October (including Audi), sold a whopping eight thousand three hundred or more in November by carrying out large-scale discount sales. It was a new sales record for one month. Tiguan, which announced a 19% discount or 60 months interest-free installment, won the title of continuous best-selling imported car following 2014. It can be said as a tremendous track record. Volkswagen announced that the 60-month interest-free installment is continuing in January also. It revealed the real intention of Korean consumers again who cling to personal gain than a just cause. |
|
Advancement of imported cars with performance for price at front is unobstructed. Imported cars are now creating a situation to compete with price in addition to the performance. What kind of selections will Korean consumers make? |
|
|
| |
|
|
3. Which one should be blamed? Product or Brand? |
|
|
|
– Hated is not domestic cars but domestic company |
|
– Domestic automakers have ‘capacity’ but with so so ‘product’ and awful ‘management’ |
|
– Imported cars’ strength is in product but have weaknesses in cost and service |
|
|
When consumers view the cars, they not only look into the car. But they take all the various aspects into account including not only the price & quality of car but also the provided services, and the role & activities of the company. The reason for consumers to buy imported cars was because of good quality and value for the price. And then, what is the reason for leaving the domestic cars? That is because they do not like companies rather than car. |
|
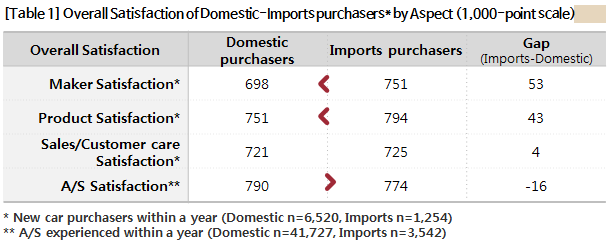
The consumers who purchased new car within one year were asked to evaluate ‘Customer care’, ‘Product quality’ such as the features and performance, experienced ‘A/S service’, and all the aspects (product, service, image, etc.) of the automaker of the car that were experienced while buying and after buying the car. They were asked to grade in a 10-point scale in order to determine Overall Satisfaction of each aspect (1,000-point scale). In the result, imported cars was much higher than the domestic cars in ‘Overall satisfaction for maker’ and automobile ‘Quality’ among the 4 aspects. Domestic cars was somewhat ahead in ‘A/S service’, while in ‘Sales and Customer care’, both were at a similar level [Table 1]. |
|
 |
|
When looking into the gap between domestic and imported, there was a large gap of 53 points in the ‘Maker satisfaction’ between imported cars at 751 points and domestic cars at 698 points. When looking into the relationship with the other scores, the reason for the large gap like this is because of the unusually low ‘Maker satisfaction’ of domestic cars. ‘Maker satisfaction’ of domestic cars is not only less than 700 points alone but also over 20 points lower than ‘Sales/Customer care’, which is the next higher score (721 points). For domestic car, the consumers purchased the car of the company by selection and relatively satisfactory for the car, but they are not satisfied with the company. On the other hand, in the case of imported cars, they have high satisfaction for the product with not low satisfaction for the company. |
|
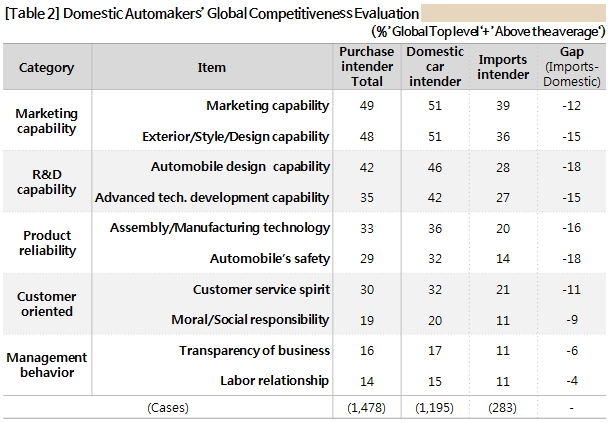
When the consumers, who purchased new car less than one year, are so negative about automaker like that, what about the evaluation of consumers who intend to buy a car? New car purchase intenders within two years were asked about the level of Korean automakers’ global competitiveness in 12 aspects including ‘R&D capability’, ‘Customer relationship’ & ‘Management’. In the percentage of evaluation for top two categories (Global top level + Above-average level) on 5-point scale from entire intenders, ‘Marketing capability’ was the highest at 49%, followed by ‘Design capability’ ( 48%) in order [Table 2]. |
|
 |
|
By major category, ‘Marketing capability’ had the highest evaluation, followed by ‘R&D capability’. ‘Product reliability’ was lower than that, while ‘Customer-oriented’ had more negative response and ‘Management behavior’ had the lowest score. In summary, the domestic auto makers have competitiveness in ‘capability’ aspects but their ‘Product’ is insufficient and ‘Management behavior’ is in backward state. |
|
When viewing by dividing into intenders of domestic cars and imported cars, imported car intenders had much more critical view on domestic automakers in all 12 aspects. In particular, only a few (11%) responded that there are competitive edges in the ethical aspects such as ‘Moral/social responsibility’, ‘Transparency of business’ & ‘Labor relationship’. |
|
This result gives a hint that the reason why Korean consumers do not like the domestic automakers, lies not in the products and services they offer but in the closed nature and disarrayed state of business management. Moreover, domestic car purchase intenders consider domestic cars not because they like the companies with a matter of degrees. That’s because there is no suitable alternative. |
|
In the flip-side of the attitude of many consumers who want to switch to imported cars, there is a feeling of rejection for the domestic automakers rather than dissatisfaction for product & service. It is considered that they have capability but not good in ethical assessment. It is natural for such consumers to assess imported cars more attractive than actual state, and intend to switch upon such assessment. |
|
|
| |
|
|
4. Greatly satisfied when switching from domestic to imported cars!
What about vice versa? |
|
|
|
– Greatly dissatisfied are the consumers switched from imported cars to domestic |
|
– Dissatisfaction of Automobile consumers lies on the ‘company’ rather than ‘car’ |
|
– Consumers who switched to domestic from imported car are on watch list |
|
|
Sprint of imported cars is being continued. That is because there are many consumers who believe in Imported cars for good quality and value over the price. However, it is just one of the reasons. Many consumers are more negative about ‘company’ than domestic ‘car’. Imported cars’ excellence in product along with the feeling of rejection for domestic carmaker, both of which is growing the imported car market with synergy effect. |
|
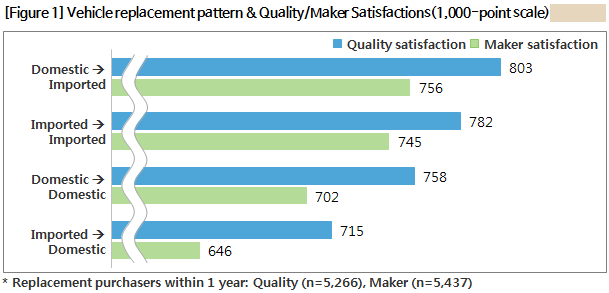
The consumers, who have replaced the car during the past 1 year, were asked how satisfied they are for the current car’s quality and the maker. ‘Quality satisfaction’ and ‘Maker satisfaction’, calculated in 1,000-point scale, were compared by considering the previously owned car. The case with the highest satisfaction in overall was ‘Domestic→Imported’ that switched to imported cars from domestic cars, followed by ‘Imported→Imported’, ‘Domestic→Domestic’, in the order with ‘Imported→Domestic’ at the lowest. [Figure 1] |
|
 |
|
In the survey results, all of the four replacement patterns displayed higher satisfaction for the quality than the maker, while imported car buyers had higher satisfaction than the purchasers of domestic cars. When comparing by replacement pattern, ‘Domestic→Imported’ was the highest in both of the two aspects, quality and maker satisfactions, followed by ‘Imported→Imported’,‘Domestic→Domestic’and‘Imported→Domestic’,inorder. ‘Imported→Domestic’ was lower than the opposite case ‘Domestic→Imported’ by 110 points in Maker satisfaction and by 88 points in Quality satisfaction. Why ‘Imported→Domestic’ has such low satisfactions for the Maker and Quality with large gaps requires a thorough investigation. |
|
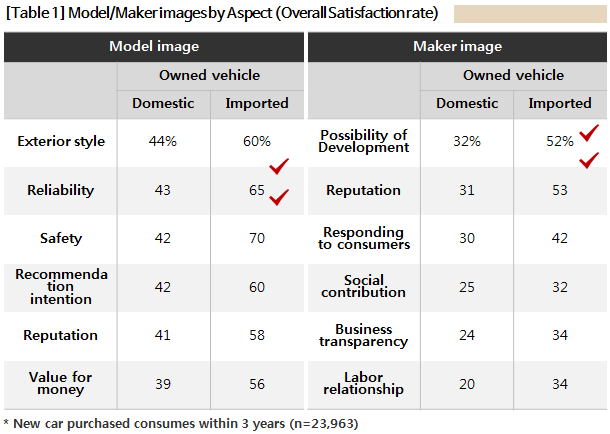
In order to confirm that in which aspect of the quality image and maker image there are gaps between domestic cars and imported cars, six questions for each of the models and the makers were presented to the consumers, who purchased a new car within three years. After scoring on 10-point scale, the rate of 8 points or over was summarized as satisfaction. |
|
The overall result was the same as the previous one, the higher model image than maker image. Regardless of Domestic and Imports, all six questions of ‘Model image’ were higher than the six ‘Maker image’ items. In addition, there was a large gap between imported car owners and the domestic car owners. In almost all the questions, the positive evaluation of imported car owners was higher by 10%p or over [Table 1]. |
|
 |
|
When comparing the satisfaction rate of each image aspect, the gaps between domestic and imports were remarkably large in both images of ‘Model’ and ‘Maker’. The satisfaction rates of domestic cars in the six ‘Model’ images ranged from 39% to 44%, having large gaps with imported cars ranging from 56% to 70%. The highest of domestic (Exterior style at 44%) was 12%p lower than the lowest of imports (Value for money at 56%). In ‘Safety’ aspect, imported cars was at 70%, which is the highest among all the evaluations with the largest gap with domestic (28%p), presuming what is the greatest strength of imported cars. |
|
In six ‘Maker images’ also, domestic ranged from 20% to 32%, while imported ranged from 32% to 53%, displaying the lowest of imports at the same level with the best of domestic. There was a gap between the imported and domestic to the extent of different class, and the different was greater in the model images. |
|
The question items with over 20%p gap between the domestic and Imports were ‘Safety’ (28%p) and ‘Reliability’ (22%p) in the quality area of ‘Model image’, and ‘Reputation’ (22%p) and ‘Potential for development’ (20% p) in ‘Maker Image’. In other words, imported car owners are considering the quality of domestic cars as particularly vulnerable in safety and reliability aspects compared to domestic car owners, and viewing domestic car companies as having not good reputation and no bright future. |
|
The questions with the lowest evaluation were labor-relationship (20%) and business transparency (24%) of domestic carmaker. Those aspects had the lowest evaluation in Global competitiveness evaluation (see 16 ? Special issue 03: Which one should be blamed? Product or Brand?) also that re-confirms the basis of the consumers’ feeling of rejection for domestic cars lies on the management behavior of automakers. |
|
The reason for consumers gathering to imported cars is because of the powerful attraction factor of value for the price in the quality of imported cars, along with the dissatisfactory management behavior of domestic automakers, working as an avoidance factor at the same time. In the formation of such a consumer environment, the influence of the recent ‘Domestic→Imported’ or ‘Import→Domestic’ switching experienced consumers is extremely important. Their assessment is convincing in terms of recent experience in both of domestic and imported cars, and would be fairly reliable information to the people around. People who switched to imported cars from domestic have a possibility to talk actively about how good their new cars are and how they are satisfied. In opposite case, there is a possibility to talk about how dissatisfied they are now and regret. |
|
Recently there are increasing numbers of customers who are going back to domestic cars from imported cars. There are some people welcoming it as the recovery sign of domestic cars’ competitiveness. It’s not certain why they went back to domestic cars, but the possibility of those people to be a help domestic car appears to be thin. They have a possibility to send more people to imported cars by pouring out dissatisfactions for the newly bought domestic cars and the makers, while professing themselves as living witness. |
|
|
| |
|
|
5. Hyundai Motor, a company that does reverse discrimination
after growing because of consumers |
|
|
|
– Discriminate domestic consumers in quality assurance & parts aspects |
|
– Becoming better are the company owner and labor union only when Hyundai performs well |
|
– Hyundai Motor labor union is selfish nobility union |
|
|
Consumers are not satisfied with the quality of domestic cars, and have dissatisfaction against the company. The reason they are flocking to imported cars is the result of these two factors working at the same time. Realistically, domestic car means mostly Hyundai Motor, and the disappointment of consumers is focused on Hyundai Motor. A part of them are becoming anti-Hyundai beyond disappointment. Why did they become antagonistic? |
|
There are a large number of anti-Hyundai crowd on the Internet. Among them, there are moderate and reasonable anti-Hyundai but some are extremists. Although there are few, some people are almost paranoid. They unconditionally believe likable information but unconditionally ignore dislikable one. They are sarcastic and ridicule the positive talks about Hyundai but they are automatically sympathy as long as it is a negative, while pouring out favorite abuses and curses. |
|
Problem is that the number of people who behave like that and sympathize to such claims is gradually increasing. Consumers’ experienced satisfaction with the company called Hyundai Motor is continuously going down. Unlike the market share, it is mired from the lowest rank among entire automakers. Among the customers who purchased Hyundai car as new car within the past one year, less than 40% showed a satisfactory response (8 points or more in a 10-point scale). They bought Hyundai model because there is no suitable alternative, not because they like the company. |
|
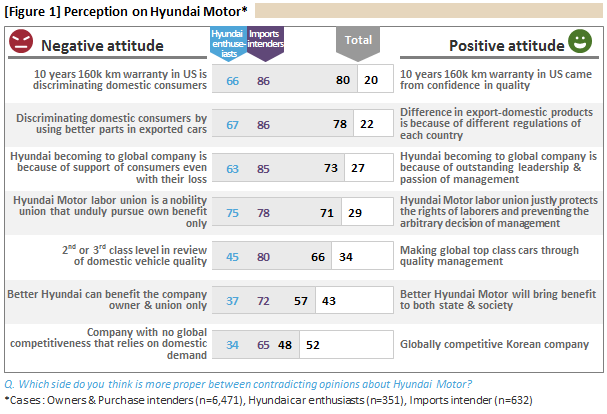
In order to find out what is at the root of this attitude, seven conflicting opinions for Hyundai Motor were presented to ask which side they sympathize between positive and negative opinions. In the result, most of the consumers are more empathized with negative opinions. The largest empathy includes the claim that it is discrimination against domestic consumers with ‘Warranty policy in the United States’ (80%) & ‘Use of better parts in exported cars’ (78%) [Figure 1]. In other words, 8 out of 10 consumers believe that Hyundai Motor is preferential to overseas consumers, while discriminating domestic consumers. |
|
 |
|
The more important issue beyond ‘Discrimination’ itself is the recognition, from which they are being discriminated. 3/4 (73%) of consumers believe that Hyundai Motor has grown to a global company because of ‘the domestic consumers who had supported it even with their loss. Nevertheless, rather than the opinion to view better Hyundai Motor bringing ‘Benefit to both the state and society’ (43%), ‘Only good to the company owner and labor union’ was the predominant opinion (57%). In addition, 7 out of 10 people (71%) agreed to ’Hyundai Motor labor union is a nobility union that unduly pursue their own interests only’. |
|
In summary, the majority of consumers believe that Hyundai Motor has ignored the dedicated contribution of domestic consumers but has been diligent to fill their (owners and union) benefits, while returning the favor with the cold shoulder in quality and service aspects. |
|
Such opinion is not common to everyone. The opinion of Hyundai car enthusiasts, who bought Hyundai car as the past & current cars and will buy Hyundai car even in the future, is different. They are 20%p less negative on the facts such as discrimination and contribution, while more positive about current status and future. They prospect that Hyundai is doing well now, although there is a little discrimination, and will benefit the national society. |
|
On the other hand, the consumers, who consider imported cars as the next purchase, are much more critical. Especially, they are very negative on the current situation and the future. Unlike Hyundai car enthusiasts, imported car intenders have given up the expectation already.
|
|
Hyundai car enthusiasts and imported cars intenders displayed contradictory tendency of positive and negative in 6 out of 7 questions, as compared to the entire respondents. More negative reaction from both sides came out from the question related to ‘Nobility union’. 71% of the entire consumers called it as ‘Nobility union’, while Hyundai car enthusiasts and imported cars intenders were more critical at 75% & 78%, respectively. That’s because Hyundai car enthusiasts are viewing the relationship between union and the company as confrontational with each other by separating them. |
|
When looking at the results so far, consumers are more critical for the company rather than Hyundai Motor products, while the core of the antipathy against company is the sense of reverse discrimination even with the contribution to the growth. It’s because they see the behavior of Hyundai Motor as ungrateful. Such idea is not only make many consumers switch to imported cars, but also generates the anti-Hyundai propensity. |
|
And then, which Hyundai Motor related experience or judgment does make consumers to give up, or make them aggressive? |
|
|
| |
|
|
6. 70% of imported cars ‘will certainly engage airbag upon accident’.
How about domestic cars? |
|
|
|
– Domestic cars take only 25% |
|
– Domestic car owners trust seatbelt more than air bag |
|
– A half of them don’t know about the number & type of airbags |
|
|
The biggest weakness of the domestic car evaluated by consumers is ‘Safety’. There are several importantly considered specific features by consumers such as vehicle price, fuel economy, design, etc. However, the biggest difference in comparison with imported cars always happens in safety. The reason why safety is important is not because of the stability under normal driving situations, but because of the faith that it can reduce how much injury or risk in special circumstances. The consumers’ confidence on the safety of domestic car had been far below of imported cars, and the main cause was airbag. |
|
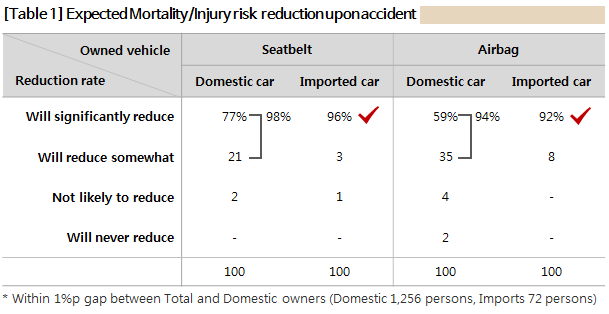
For the typical user protection device of vehicle, seatbelt and airbag, the drivers (1,329 persons) were asked about how much they expect ‘the seatbelt and airbag in your car will reduce the risks from accident such as injury/death. As a result, in the case of domestic car owners, the answer of ‘Will significantly reduce’ appeared as 77% for seatbelt and 59% for airbag [Table 1]. On the other hand, imported car owners had 19%p and 33%p, respectively, higher rates of ‘Will significantly reduce’ with seatbelt at 96% and airbag at 92%. That was the similar size of ‘Significantly + Somewhat’ of domestic cars (98% & 94%, respectively). |
|
 |
|
This results indicate that ▴ imported car owners had higher trust on the safety equipment than domestic car ▴ imported cars had no big difference between seatbelt and airbag ▴ domestic cars had much higher trust on airbag than seatbelt. In other words, domestic cars are questionable for both seatbelt and airbag, but airbag is a larger problem. |
|
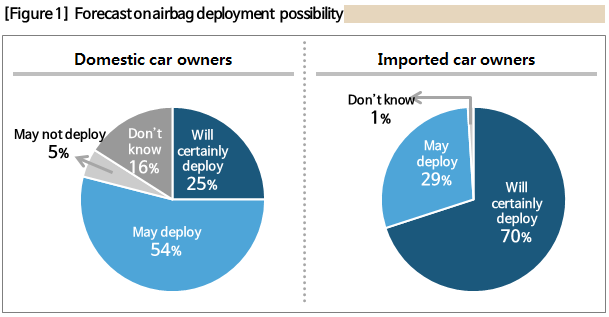
‘Will the air bag equipped in your car deploy upon accident’ was asked. As a result, only 25% of domestic car owners said ‘Will certainly deploy’, whereas 70% of imported cars said so [Figure 1]. Only 1 out of 4 domestic car owners trust airbag, while a majority (54%) had a hopeful outlook as ‘May deploy’. Beside of them, 16% said ‘Don’t know’ and 5% said ‘May not deploy’, indicating only a handful people having faith on airbag. |
|
 |
|
On the other hand, 99% of imported car owners said that ‘Will certainly deploy (70%)’ or ‘May deploy (29%)’, vividly displaying the significant trust on airbag. |
|
Consumers, in fact, did not know much about airbag. 45% didn’t know how many airbags are equipped in their car, while 54% didn’t know what kinds of airbag (for example; SRS, etc.) are there. However, more important than such knowledge is trust. Regardless of the number and type of the airbags, it should be believed to protect me in case of emergencies. |
|
Hyundai created an official blog, ‘Hyundai says’, and opened a section called ‘Misunderstanding and truth’. It appears to be an attempt to resolve the ‘Misunderstanding’ of consumers by revealing the ‘Truth’. In this blog, 2 out of 6 subjects that had been dealt with until now are about airbag, and the most recent one was ‘Hyundai airbag doesn’t pop up?’ Hyundai Motor is also well aware of the consumers’ distrust on airbag. |
|
Being unjustly misunderstood means suffering unfairness. Hyundai Motor announced that its airbag is superior against other domestic automakers or imported cars but unfortunately not being recognized by quoting the documentation of 2012 Korea Consumer Agency. The trust rate of Hyundai ? Kia owners on airbag deployment shown in this study is 23%, which is lower than domestic competitors (31%). Unfortunate thing is that it was not evaluated at 8%p lower than domestic competitors, but it had not reached 1/3 lev el of imported cars at 70%. More unfortunate is how it has received such distrust with excellent products by treating consumers in what kind of relationship. |
|
However, the party really suffering from unfairness is the consumers. That’s because they have to purchase untrustworthy airbag at expensive price unconditionally, and drive the car with the expectation of ‘may deploy, probably will be helpful’ as collateral in case of an emergency. They are the consumers who must hope the worst case not happening to them, while looking at the unbelievable elucidation of automaker on not deploying airbag. |
|
Their interest in imported cars’ airbag at 70% trust rate is justifiable |
|
|
| |
|
|
7. Vehicle corrosion, five times of imported cars |
|
| <Joint Syndicated study with Korean Automobile Consumers Union> |
|
|
– Hyundai-Kia cars have more cases than 3 domestic competitors |
|
– Since 2007, it reached an average level through partial improvement |
|
– Partial improvement was focused on visible external plate excluding lower body |
|
|
In terms of being able to check the status of the problem visually, corrosion is significantly different from the problems such as function and performance. There is a little room for discussion. Whether there was corrosion on the vehicle and where the corrosion happened were asked to the consumers. As a result, Hyundai-Kia cars had more corrosion than imported cars as a matter of course, as well as 3 domestic competitors. The gap with imported cars was so large that it’s hard to tell it’s able to compete in overseas. If there are large gaps in the corrosion problems occurred by domestic automakers, it should be accountable for the difference in the raw materials or processing steps, rather than use environment or management. |
|
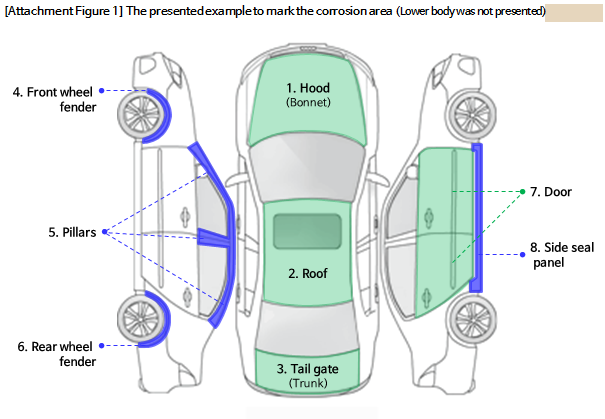
Consumer Insight along with Korean Automobile Consumers Union (President, Lee, Jeong-Joo) conducted a joint syndicated study (fielded in July 2015), which asked 35,370 consumers who owned new car for 5 years or over about △ whether to have corrosion on painted face (exterior plate) or lower body △ on which area the corrosion occurred among 10 areas including fender and lower body [Attached Figure 1]. |
|
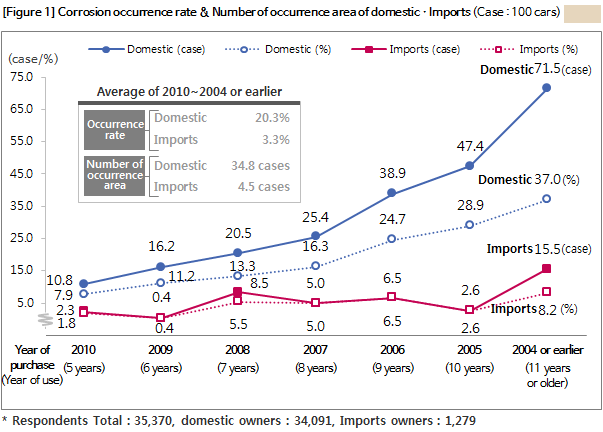
First of all, corrosion experience rate and number of experienced corrosion (the number of occurrence area) were calculated by dividing into imported cars and domestic cars. The corrosion experience rate of the entire respondents, whose ownership period is 5 years or over, were 20.3% for domestic cars and 3.3% for imported cars, showing domestic cars with corrosion at six times of imported cars [Figure 1]. The number of experienced corrosion (per 100 cars) were also average 34.8 cases for domestic cars and 4.5 cases for imported cars, displaying 8 times more domestic cars. These differences show the huge gaps in corrosion aspect between imported cars and domestic cars that is meaningless to compare. |
|
 |
|
The corrosion occurrence rate and the number of cases had increased as the used year increases, in other words, longer purchase time. In the number of corrosion occurrence cases, five years used (purchased in 2010) imported had 2.3 cases, while domestic had 10.8 cases per 100 vehicles, displaying 5 times more domestic cars. This trend has followed continuously, and among over 11 years used cars (purchased in 2004 or earlier), imported had 15.5 cases, while domestic had 71.5 cases, also displaying 5 times more domestic cars. Therefore, in overall, the corrosion problems of domestic car can be five times of imported car. |
|
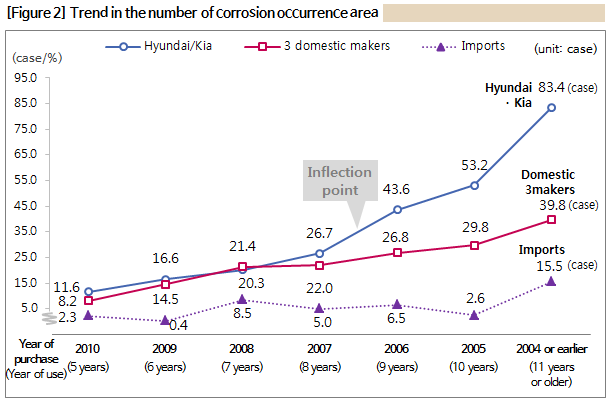
The number of corrosion occurrence cases was arranged by dividing into Hyundai-Kia, 3 domestic carmakers and imported cars. Hyundai - Kia had average 83.4 cases among the 11 years or older cars that were greater than any other competitors [Figure 2]. Hyundai-Kia cars manufactured before 2004 had twice more corrosion occurrence cases than the 3 domestic carmakers (39.8 cases) and five times more than imported cars (15.5 cases). It clearly indicates that there were more problems regardless whether it’s on steel plate or in the painting and rust-proofing process. |
|
 |
|
Hyundai-Kia, which had much more number of corrosion cases than 3 domestic carmakers, has reduced to the similar level with them since 2007. And that partially supports the official position of Hyundai-Kia, saying the difference of steel plate between exports-domestic had been removed since 2007. However, the gap with imported cars is still outstanding, not appearing as at equal level with imported brands for competition in overseas. |
|
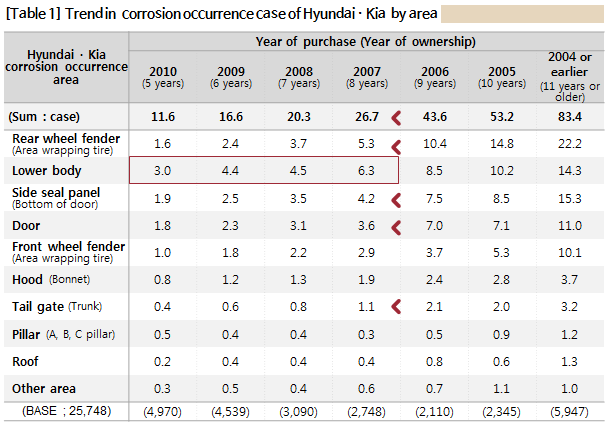
The number of corrosion occurrence cases by purchase year of Hyundai-Kia cars was divided into occurrence area for analysis. When looking at the gap between 2006 and 2007 that can be called an inflection point, Hyundai-Kia had reduced by 40% with a large gap with other carmakers that had reduced by around 20%. By area, ‘Rear wheel fender’, ‘Side seal panel’, ‘Door’ and ‘Tail gate’ areas had sharp reductions to half the level [Table 1]. This result indicates that there was a clear improvement effort with not so small outcome since 2006 but that was not full-scale improvement. It is estimated that there were improvements around a particular area and particular process. Although Hyundai-Kia Motors had improved to the similar level with the average of other 3 domestic carmakers since 2007, there is a still too far distance with the imported cars to be compared. |
|
‘Lower body’ was not the area with high number of corrosion but since 2007, it emerged as the highest corrosion area. In other words, the improvement in 2006-2007 was done around the visible outer plates, while the hard-to-confirm lower body seemed to be excluded. However, lower body corrosion of this study was significantly underestimated compared to reality. In the course of surveying, unlike other areas, lower body was not presented as one of the answers (Refer to attached Figure 1). If it was under same condition, it would have a far more pointed outs. Furthermore, when considering the fact that check-up opportunities are limited unlike other areas, there would be a lot more problems of lower body corrosion. |
|
 |
|
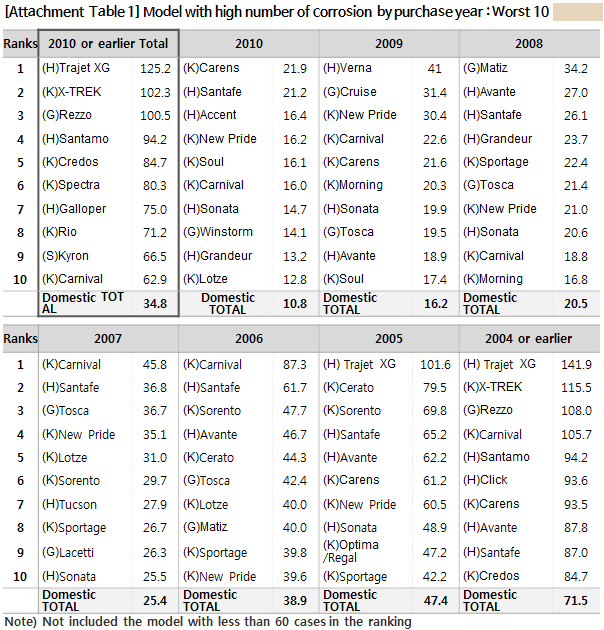
By vehicle model, the models with the highest number of corrosion area by purchase year include ▴ 2004 or earlier & 2005 Hyundai Traje XG ▴ 2006 & 2007 Kia Carnival ▴ 2008 GM Korea Matiz ▴ 2009 Hyundai Verna ▴ 2010 Kia Carens [Attachment Table 1]. Among the entire models currently in service, Hyundai Traje XG & Kia X-Trek were accounted for the disgraceful 1st and 2nd places. |
|
Hyundai created an official blog, ‘Hyundai says’, and opened a section called ‘Misunderstanding and truth’. It appears to be an attempt to resolve the ‘Misunderstanding’ of consumers by revealing the ‘Truth’. In this blog, the first 4 out of 6 subjects that had been dealt with until now are about steel plate, and the very first one was ‘Corrosion’. The ‘Misunderstanding’ to be resolved with the highest priority by Hyundai in relation with consumers is known to be corrosion in this perspective. |
|
The study result supports that it is more of the ‘Truth’ than the ‘Misunderstanding’ that the perception of consumers believing ‘different steel plate for domestic demand from exported’. If the domestic demand and exported are the same, Hyundai has competed in overseas until now with the cars having five times more corrosions than imported cars. In the United States, Hyundai offers 7 year warranty for penetrating corrosion. Offering this kind of warranty with the same car in domestic market is unrealistic. Or else, the story in which foreign brands have exported the cars with 1/5 less corrosion than domestic cars to Korea only doesn’t make sense at all. |
|
Recently a high official of Hyundai Motor said, ‘the steel plate for North America have used more galvanized plates because of corrosion’ and ‘there is no difference in steel plate between exported and domestic demand by applying 80% galvanized plate in domestic demand vehicle from this year (2015)’, which brought a great disturbance. But it was calmed as a happening by the urgent clarification as ‘confused comment’ from the public relations department, and no difference from 2007 was established as ‘Truth’ again. |
|
The real ‘Truth’ is a concern. Even if as a ‘confused comment’, it is a wish to be a ‘Truth’ that there is no difference since 2015. |
|
 |
|
 |
|
|
================================== |
|
♦ Reference : 「Consumer Insight」 Annual Automobile Syndicated Study Outline
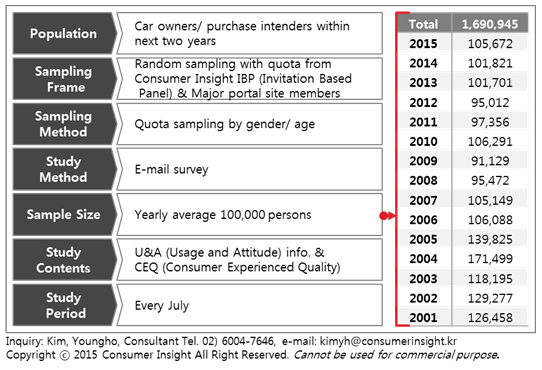
The contents was excerpted and summarized from the results of annual ‘Automobile Syndicated Study’
conducted by Consumer Insight Inc. in every July since 2001. |
 |
|
|